Colour Theory
Colour Mixing Chart for Coloured Pencils: Make Your Own
Build your own colour mixing chart for coloured pencils (colored pencils in the US) with a two- and three-layer grid, pressure notes and a printable-style layout.
This guide contains affiliate links. If you buy through them we may earn a small commission at no cost to you. How this works.
Jump to recommended products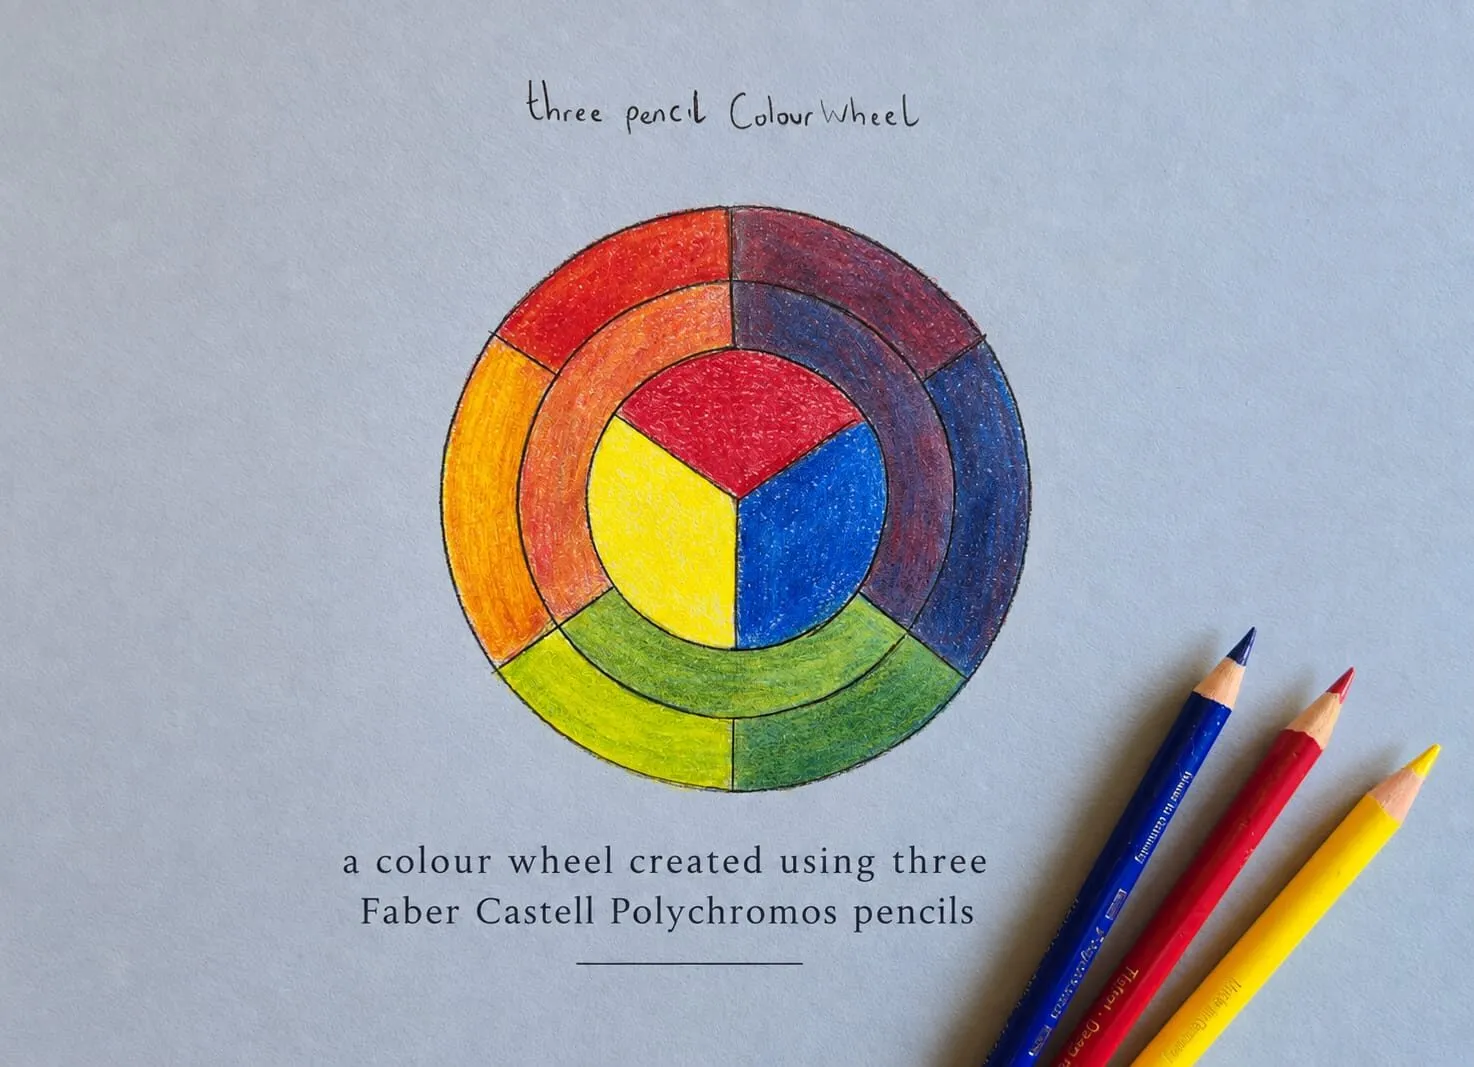
Key takeaways
- ◆A mixing chart made with your own pencils on your own paper is more reliable than any printed chart, because every range and paper behaves differently.
- ◆Use a grid: pencils down the side, pencils across the top, and each square is the top pencil layered over the side pencil.
- ◆Record the layer order and pressure for every square, because the same two pencils give different results in a different order.
- ◆Add a three-layer section for the mixes you use most, such as browns, greys and skin tones.
- ◆Keep the chart beside your drawing and photograph it, and test your reference colours against it.
A colour mixing chart is a record of what your own pencils do together on your own paper. It takes an afternoon to make, and it answers the question you will face in every drawing: which two or three pencils do I layer to get this colour? No printed chart can tell you that, because the answer changes with the range, the paper and the way you press.
This guide is written for coloured pencils, known as colored pencils in the US. It shows how to build a grid chart with two- and three-layer mixes, how to record layer order and pressure, what to learn from the finished chart, and how to use it in future drawings. It belongs to the colour theory cluster and complements the match and mix guide. Once it is done, use the palette from photo tool to see which mixes a reference needs.
Start with Michael’s colour wheel
The image at the top of this page is Michael’s hand-drawn colour wheel, made with three Faber-Castell Polychromos pencils on blue-grey paper. It is the simplest possible mixing chart: three pencils, and the colours they make where they overlap. It shows what a chart can teach you even with very little: how two pencils combine, where the blends turn neutral, and how the paper ground affects everything.
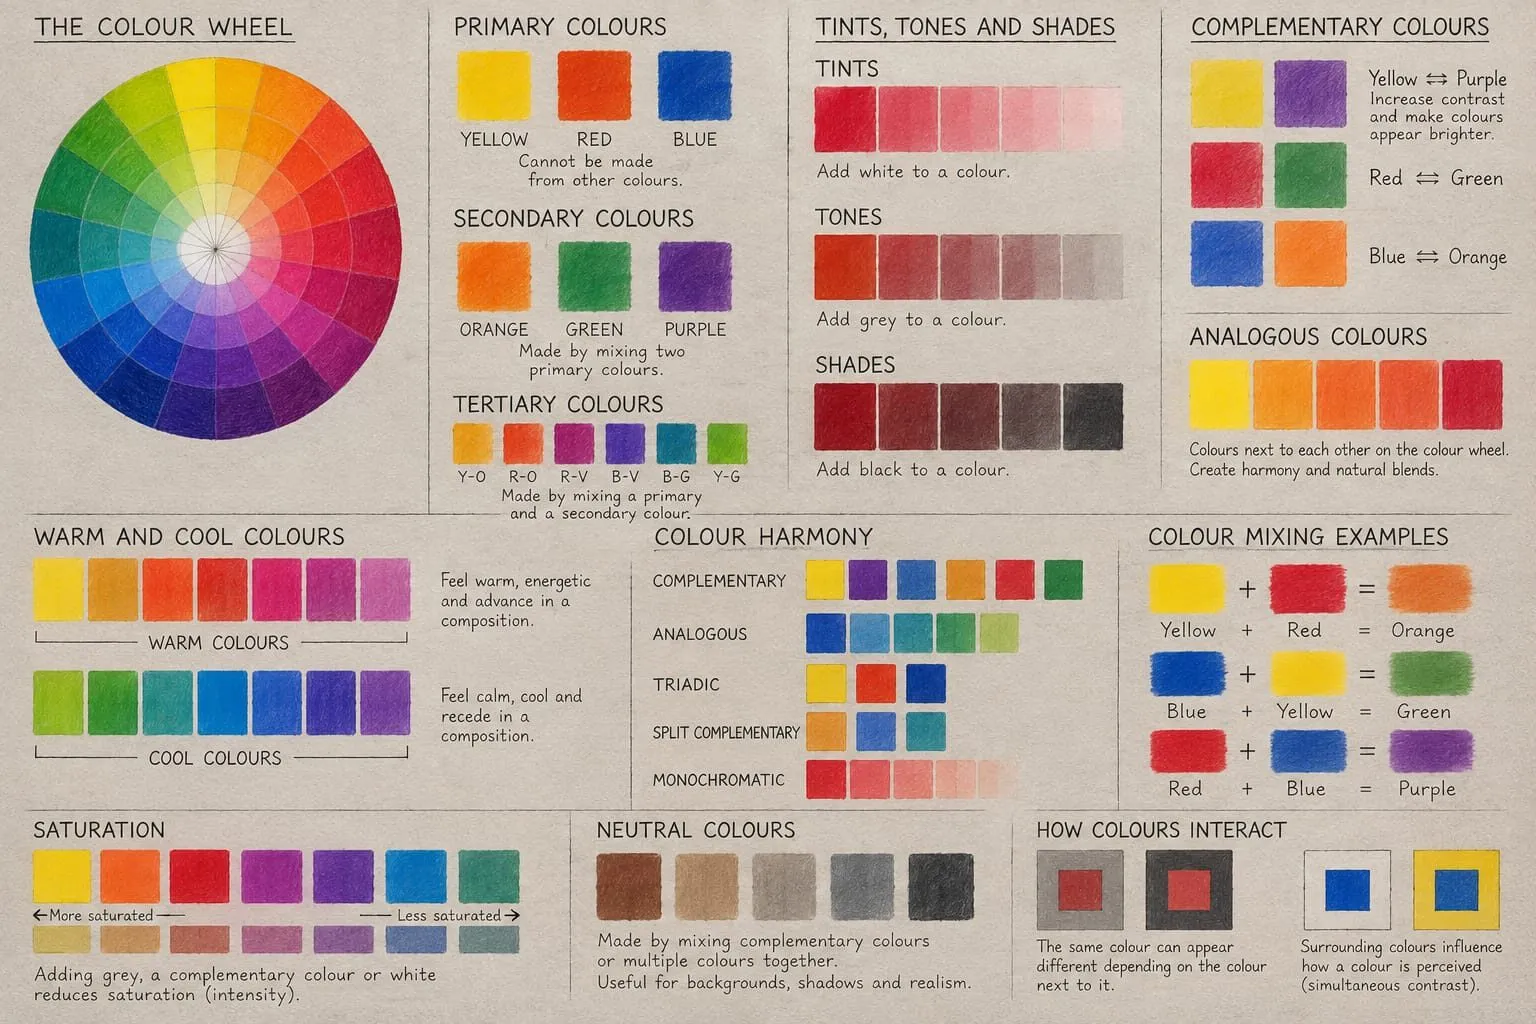
Read the colour wheel explained and primary, secondary and tertiary colours for the theory. Your chart goes further by adding more pencils and more layers.
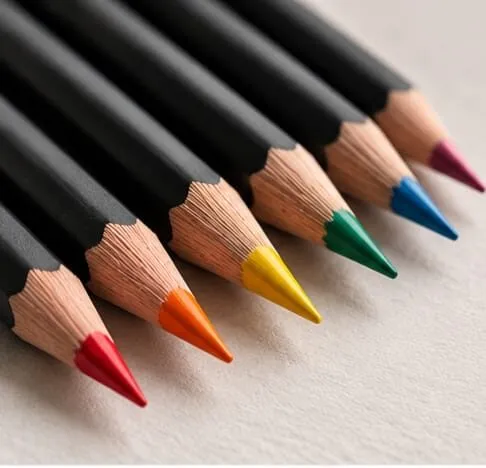
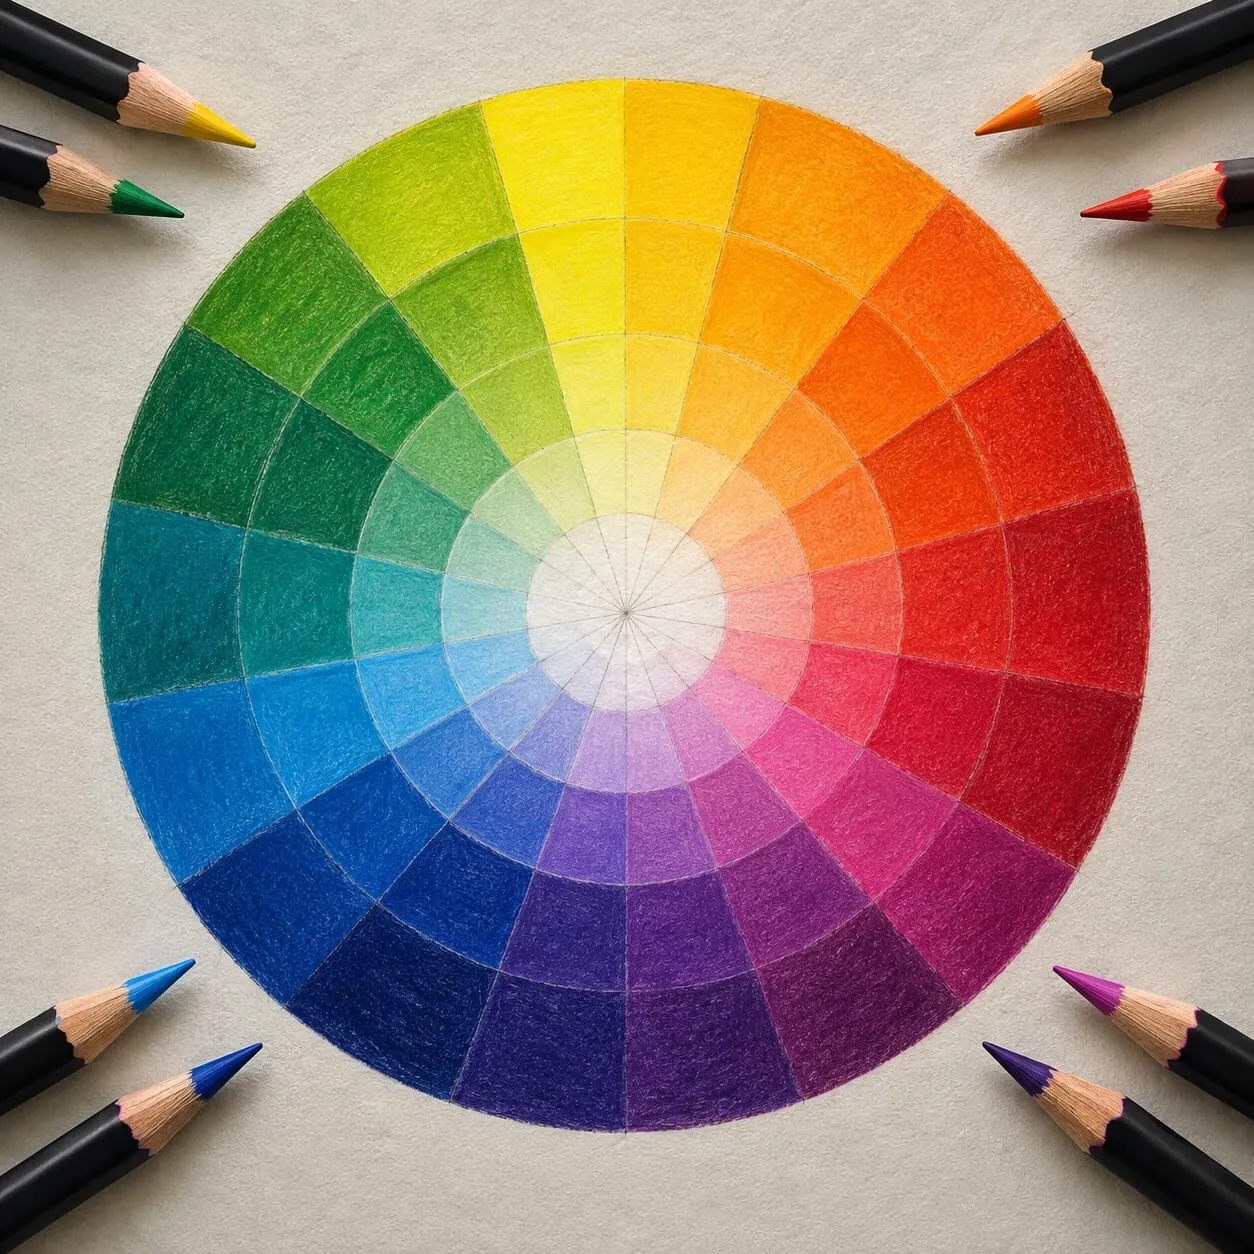
Close-up of a row of sharpened coloured pencils with red, orange, yellow, green, blue and magenta leads.
What you need
- The paper you draw on. If you work on grey paper, make the chart on grey. Colours shift on toned ground, so this matters.
- Eight to twelve pencils you use most, or a full set if you have patience.
- A ruler, a pencil and an eraser.
- A sheet large enough for the grid. A 10 by 10 grid with 2 cm squares fits on most sheets. See paper size converter if you need to plan a sheet size.
- A sharp point. A worn point changes coverage and pressure. Our sharpening guide helps.
The two-layer grid
This is the main chart.
- Draw a grid. With ten pencils, draw an 11 by 11 grid, leaving the first row and first column for the pencil swatches.
- Swatch each pencil in the first row and first column, in the same order in both.
- Fill the diagonal with each pencil alone, so you can compare mixes against the pure colour.
- Fill each other square in two steps. Lay the side pencil first, with light, even pressure. Then lay the top pencil over it, also lightly and in a different direction.
- Label the pencil names or codes clearly, in a margin, never on top of the swatches.
The grid has a neat property: the square at row A column B is B over A, and the square at row B column A is A over B. The two halves of the chart show you the effect of layer order.
A printable-style layout
Here is the structure as a table, using four example pencils described by colour. Your chart will be bigger, with swatches instead of words.
| Base (down) / top (across) | Yellow | Orange | Blue | Violet |
|---|---|---|---|---|
| Yellow | yellow alone | yellow, then orange | yellow, then blue | yellow, then violet |
| Orange | orange, then yellow | orange alone | orange, then blue | orange, then violet |
| Blue | blue, then yellow | blue, then orange | blue alone | blue, then violet |
| Violet | violet, then yellow | violet, then orange | violet, then blue | violet, then violet |
Note how the complementary pairs, orange with blue and yellow with violet, lead toward neutrals and browns. The complementary colours guide explains why.
A hand-drawn colour wheel made with three Faber-Castell Polychromos pencils on blue-grey paper. Drawing by Michael Brace.
Add pressure, not just order
Pressure changes a mix as much as the pencils do. Include at least two versions of your most-used squares.
- Light pressure, where the paper texture shows through, for glazing and soft mixes.
- Medium pressure, which is your normal working layer.
- Heavy pressure, to show what burnishing or a hard final layer does.
A simple way to record this is to divide a square diagonally: light pressure in one triangle, medium in the other. Or make a short key, such as L for light and M for medium, and write it in the corner of each square. Keep the notation short, or you will not use it.
Record everything
A chart without notes is half a chart. On the back or in the margin, note:
- The paper, including its colour and surface.
- The pencil range and colour names you used, as printed on the pencil.
- The layer order and the pressure key.
- The date and the state of the pencil point, if you care to.
Photograph the finished chart in good light, and photograph it in greyscale too. Comparing the two shows which mixes are close in value, which is what governs how they will behave in a drawing. The value study tool does the same job on any photo.
The three-layer section
Two layers cover most colours. A second chart, smaller and more targeted, handles the three-layer mixes you will really use.
- Browns and earth colours. Orange, then blue, then a touch of red or yellow to steer. See what colours make brown.
- Greys and neutrals. A complement pair plus a third colour to tilt the temperature. See how to mix grey and neutral colours.
- Deep darks. Three dark colours layered. See how to make black with coloured pencils.
- Skin tones. Ochre, rose and a cool shadow colour. See how to mix skin tones.
For each target, make a strip: the first layer, then the first two layers, then all three. You can see exactly how each layer moves the colour.
What to learn from the chart
A finished chart is useful data. Look for:
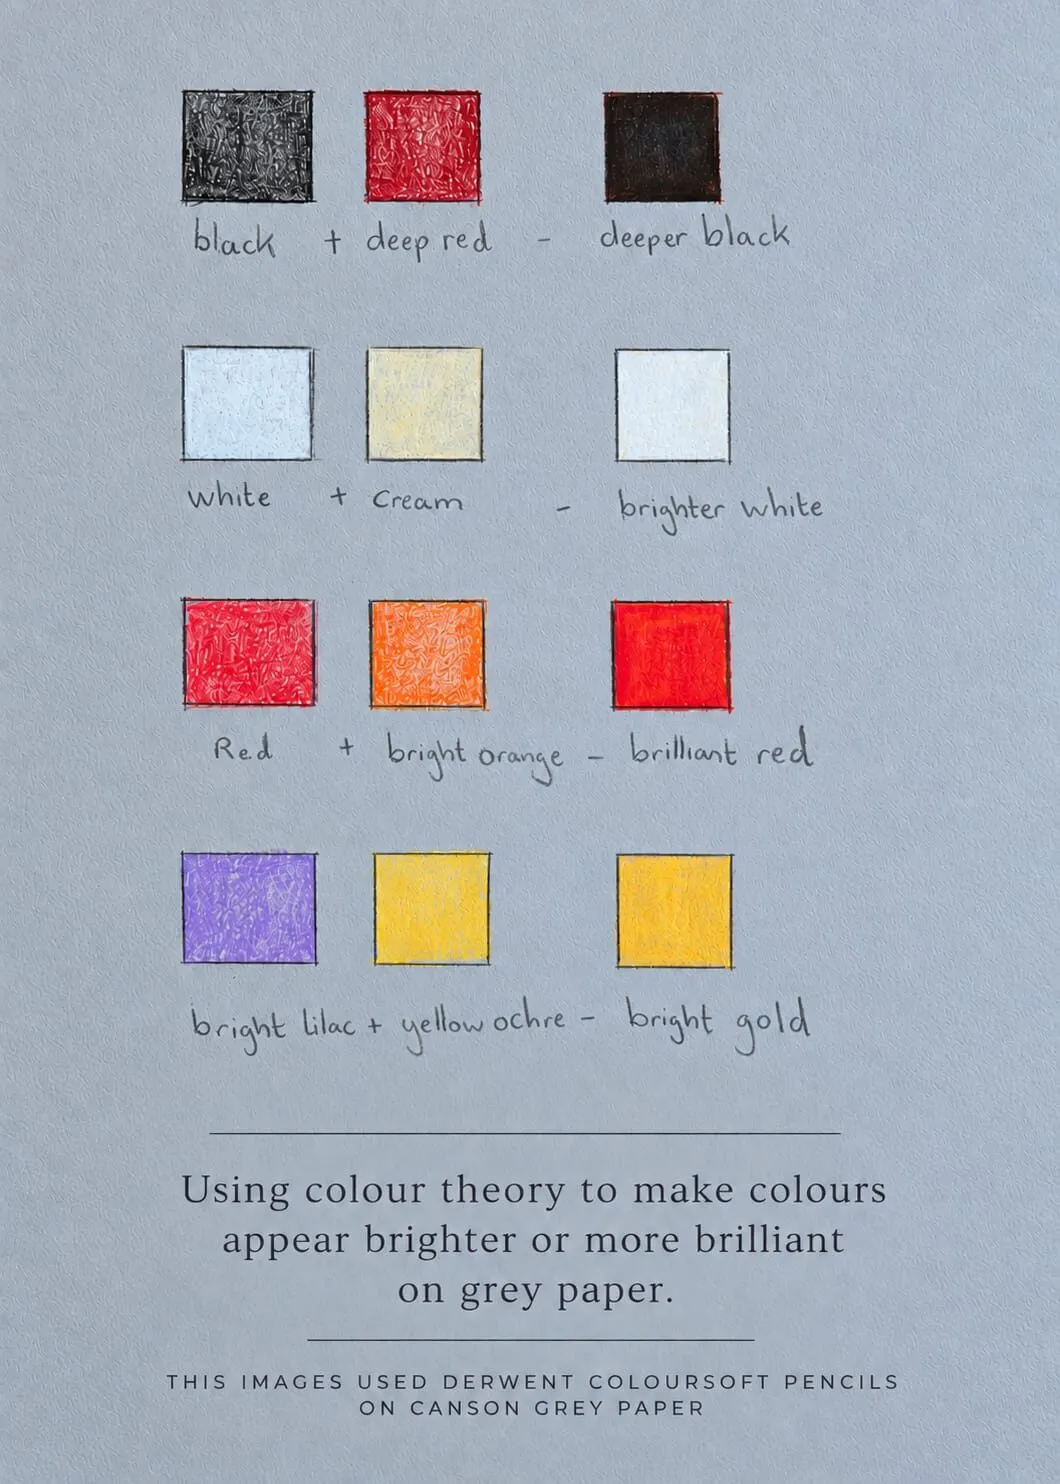
- Which pencils cover well and which are translucent. Pale, dry pencils may vanish on grey paper.
- Which pairs produce surprising colours. Some combinations give a cleaner green or a warmer brown than you expected.
- Which pairs mud quickly. Note them, and keep these layers light.
- Which pencils are duplicates. If two squares look identical, you may only need one.
- Gaps in your set. If you cannot mix a clean green, you have found what to buy. Check the best coloured pencil sets and how many coloured pencils you need.
Using the chart in a drawing
- Sample your reference. Pick the ten or so key colours with the palette from photo tool or by eye.
- Find the nearest squares on your chart and note the layer order.
- Lay your first layers from the chart, then compare your drawing to the reference and adjust.
- Keep the chart beside the drawing and hold it against your work in the same light.
If you want a ready-made harmony to start from, the colour scheme generator can suggest pairings to test against your swatches, and choosing a colour palette walks through the decision.
Common mistakes
- Making the chart on the wrong paper. White-paper swatches will not match a grey-paper drawing.
- Pressing hard. Heavy squares hide what light layering does.
- Not recording the order. You will forget which pencil went first.
- Too many pencils. A huge chart that never gets finished is useless.
- Never using it. Pin the chart up, and refer to it.
Keeping the chart useful over time
Charts get outdated when your pencils change. Date each chart, and make a new one when you add a pencil you use often. Store charts flat in a folder, or photograph them and keep the files with your reference images. If a pencil runs low or you replace a range, a chart made with the old pencils tells you what to look for in the new ones.
The short version
A mixing chart is a grid of your own pencils layered over each other on your own paper, with order and pressure recorded. Add a three-layer section for your commonly used mixes, learn which pairs are opaque, muddy or surprising, and use the chart to plan every drawing. Start small, and build from Michael’s three-pencil colour wheel idea, then see the rest of the colour theory series.
Where to buy
Recommended products
Affiliate links. We may earn a small commission if you buy, at no extra cost to you. Why?
Pencils · Faber-Castell
Faber-Castell Polychromos
Firm, oil-based artist pencils that hold a point - a benchmark for detail and clean layering.
Quick answers
Frequently asked questions
How do I make a colour mixing chart for coloured pencils?+
Draw a grid on the paper you draw on. Put your chosen pencils along the top and down the side. In each square, layer the top pencil over the side pencil with light pressure, leaving the diagonal for each pencil alone. Label the layer order, then photograph the chart for reference.
How many pencils should be on a mixing chart?+
Start with eight to twelve pencils you use most. A grid of that size has enough pairings to be useful without taking hours. You can add more pencils later, or make separate charts for skin, landscape or food colours.
Does the order of layers matter?+
Yes. Laying colour A over colour B usually looks different from B over A, especially with opaque or waxy pencils. This is why a good chart has both orders, or notes which order you used. Pressure changes the result as well.
Can I use a printed chart instead?+
A printed or screen chart is a helpful guide, but it cannot match your paper, pressure or pencils. Use it as a planning aid and swatch your real mixes. Michael's hand-drawn colour wheel is an example of the real thing, made with pencils on the paper he draws on.
Are colored pencils and coloured pencils the same?+
Yes. Coloured pencils is the UK spelling and colored pencils is the US spelling, and they are the same product. A mixing chart is made the same way for both.